Finding the best time to post on Facebook is a great way to boost engagement, drive traffic, and gain new followers.
But when no Facebook Page is created equal, how do you find your optimal time?
We're breaking it all down below — plus, how to automate your posts with the best scheduling tool.
Table of Contents
When Is the Best Time to Post on Facebook in 2024?
When it comes to the best time to post on Facebook, there’s no one-size-fits-all approach.
Each Facebook Page is unique, with different audiences, cities, and time zones to consider.
So while some encourage posting on weekends, others say the best time to post on Facebook is at 9am, no matter the day.
Here at Later, our social team found that the best time to post on Facebook is between the hours of 6am-12pm PST.
“It will really be determined on where your audience is located,” shares Later’s Social Media Manager, Christine Colling.
While using the above times as a guide, finding your personalized best time to post on Facebook is most important.
Keep scrolling, we'll show you how.
P.S. With Later's social media management tools, you can schedule your Facebook posts in advance. Create an account, today.
How Do I Find My Best Time to Post on Facebook?
To find your best time to post on Facebook, you’ll need to do a little digging (and some testing) to figure out when your audience is most active.
Here are two tactics to help you narrow it down:
#1: Check Facebook Audience Insights for Optimal Timezones
Facebook Audience Insights was designed to help plan and optimize your Facebook ad campaigns — but it’s also a valuable starting point to find your audience’s top locations.
Unlike Page Insights — which tracks interactions with your Page via reactions, comments, and shares — Audience Insights looks at your current or potential audience’s age, gender, and most importantly, location across all of Facebook.
To get started, open the Meta Business Suite, select "Insights," and then “Audience."
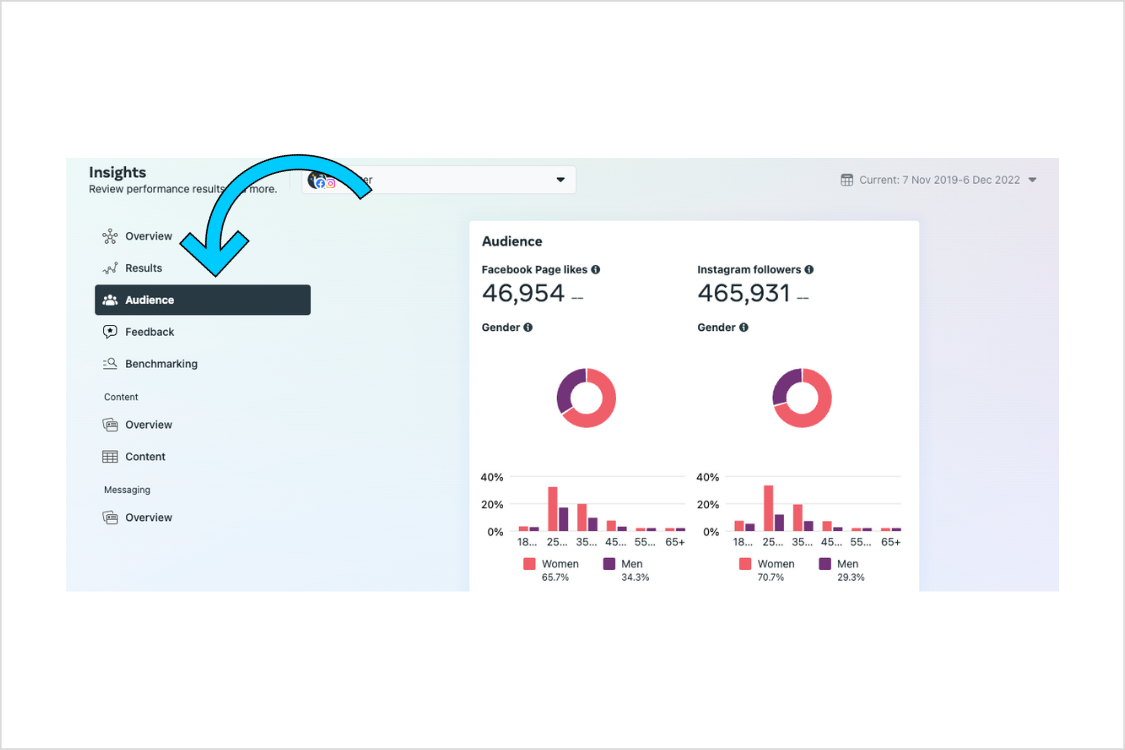
Scroll down to find the top cities and countries where your followers live.
This is extremely helpful for pinpointing your top time zones and identifying when your audience is most likely to be online and active:
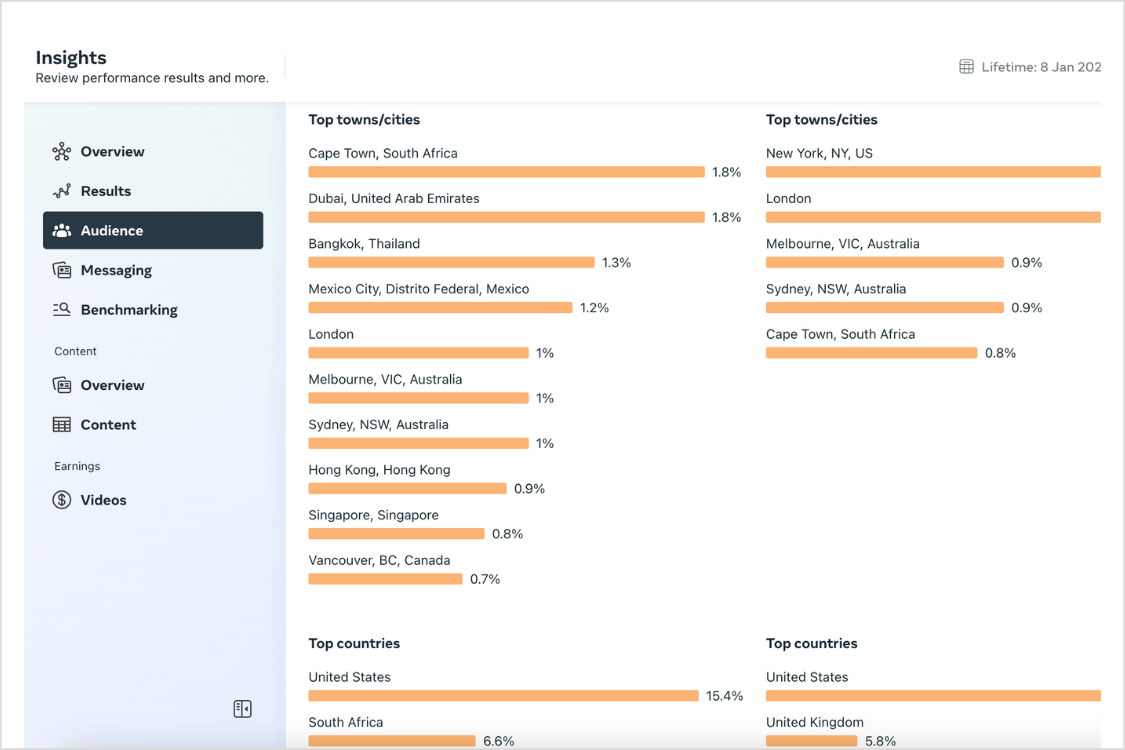
For instance, Christine notes, “Most of our followers on Facebook are from the US, UK, and South Africa, so posting when those three countries are online has worked best for us.”
TIP: You can also discover a breakdown of audience locations by using Facebook's Creator Studio.
#2: Experiment with Posting Times and Measure Your Progress
Once you have a clear idea of where your audience lives, it’s time to experiment and measure your progress!
For this, we recommend creating a spreadsheet to track how much engagement you receive when you post at different times, on different days.
Start by picking five different times throughout the week.
For example, if you notice that your followers are most active between 5 and 9pm EST, schedule your posts to appear between those times throughout the week.
In your spreadsheet, track how many likes and comments each post receives, along with the date and time you posted them:
The following week, switch the timing of your posts for each day. For example, if you posted at 5pm on Monday in week 1, post at 6pm during week 2:
It might take a few weeks, but you can use this information to help determine the best days to share content with your audience.
TIP: Schedule your Facebook posts to publish automatically with Later's management tools. No early morning logins required!
How to Schedule for Your Best Time to Post on Facebook
Now that you know when your Facebook audience is most active, you can schedule your Facebook posts to auto-publish at the most optimal times.
Here's how in a few easy steps:
Step #1: Connect your Facebook Business page to your Later Account.
To connect, log on to Later on the web (not mobile), and at the top of your calendar, click the Facebook icon.
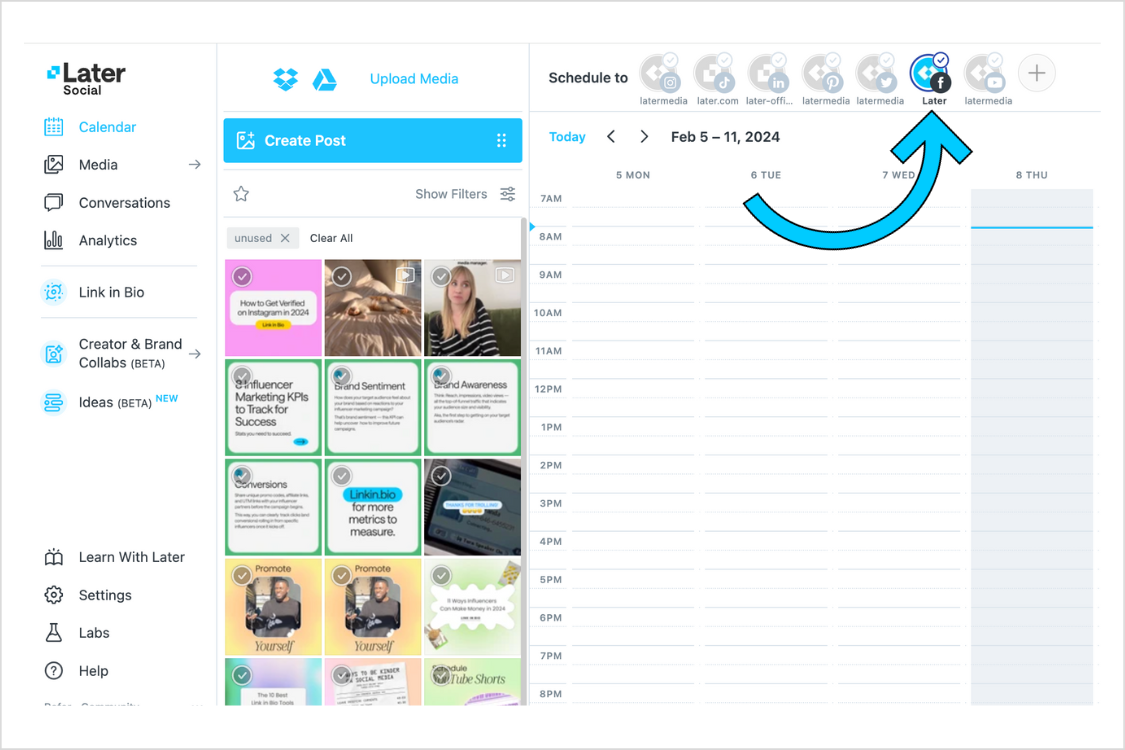
Next, follow the prompts and give Later access to your profile.
NOTE: You can only schedule posts to Facebook Business Pages.
Step #2: Drag and drop the media you want to schedule, or drag the "Create Text Post" box onto your Calendar for a text-only post.
Then, set the date and time you want the post to go out.
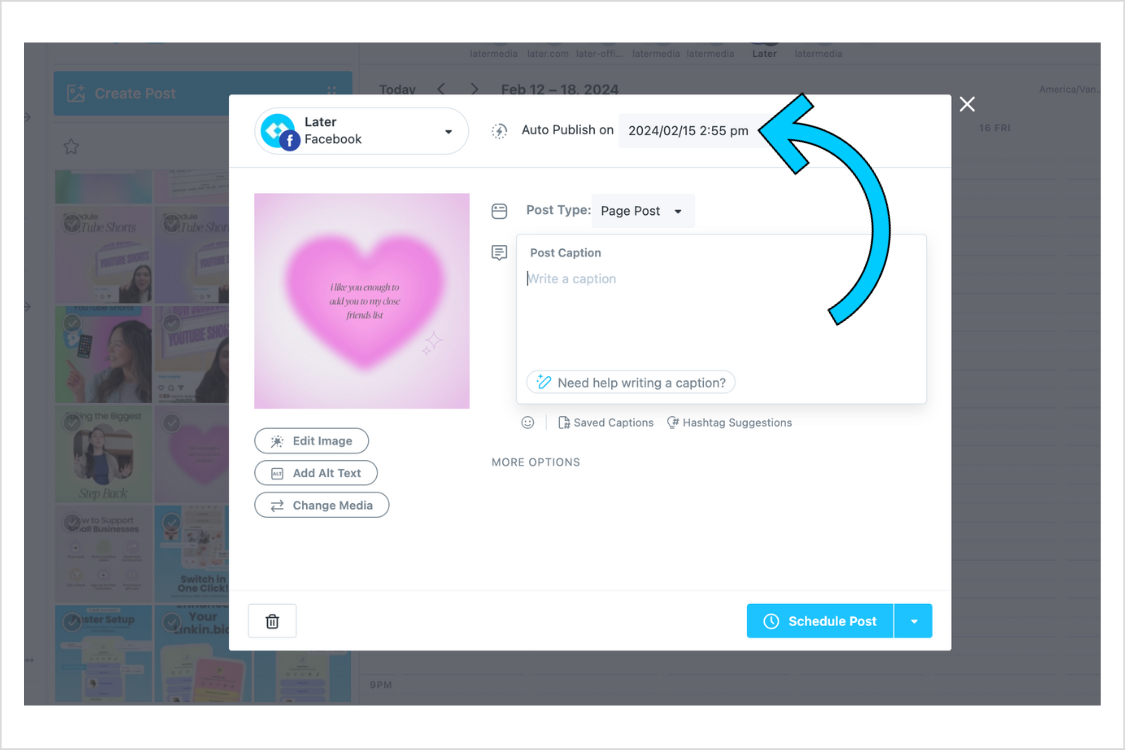
Step #3: Populate your post with a caption up to 63,206 characters, add hashtags, or use Saved Captions.
Step #4: Click "Schedule Post" and you’re all done. Your scheduled Facebook post will auto-publish to your profile.
Facebook is an incredible channel for brands and creators to achieve their marketing goals but to really stand out, you’ll need to re-think your posting strategy.
By nailing down your best time to post on Facebook, you can increase your chances of reaching your audience when they're online, active, and ready to engage!
So, what are you waiting for? Later makes it easier than ever to plan and schedule content to Facebook, Instagram, TikTok, and more! Create an account today.
